| | |
|
This group of experiments covers many important fundamental principles and is an excellent introduction to applied dynamics and vibrations. It covers the unforced, forced and harmonic responses of the classic spring/mass/damper system and includes practical exercises to reinforce theoretical concepts.
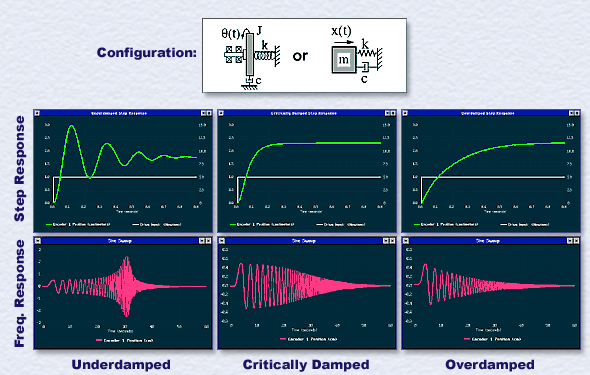
Students investigate the effects of changing the inertia, spring stiffness and damping constant on the characteristic roots and determine parameters to generate under-, over-, and critically damped systems. The unforced response to an initial displacement is obtained experimentally for each case. Then, the step-force response is measured as shown in the upper row of Figure 1. Exercises involving the homogeneous and complementary solutions to the equations of motion are given and related to test results and the concepts of rise time, percent overshoot, and logarithmic decrement are demonstrated.

Figure 1. Step And Sine Sweep Tests Help Correlate Transient and Frequency Response Behavior Students obtain the experimental harmonic response using ECP's unique Sine Sweep forcing function and various data scaling options. From the lower row of Figure 1 many characteristics are readily identified: resonance of the underdamped case, the increased medium frequency attenuation with damping (i.e. reduced bandwidth), and the common 1/w^2 high frequency attenuation. Input/output phase is also measured at distinct frequencies using ECP's scale-zooming features. These are interpreted in terms of the vector phase diagram.
 In order to more fully understand the harmonic response, the same data is replotted using ECP's Log(freq) and Db scaling options as shown in Figure 2. In this case, the upper portion of the data traces out the curve of the frequency response (Bode) amplitude in the format it typically appears in the literature. Here the classical characteristics of the second order harmonic response are seen: low frequency amplitude independent of damping, underdamped resonant frequency, decreasing mid frequency amplitude with damping, and common -40 Db/decade high frequency attenuation. By physically witnessing the system motion and plotting the data in a variety of formats, students are given a physical insight into harmonic response and its graphical representation. Finally, the harmonic responses are correlated with the transient (e.g. step) responses. For example, the common low frequency amplitude is shown to correspond to the common steady state amplitude, the reduced bandwidth with damping to increased step rise time, and the underdamped resonant frequency to the step oscillation frequency. These tests not only reinforce important theoretical concepts, but also build a practical intuition of dynamic system behavior! | |